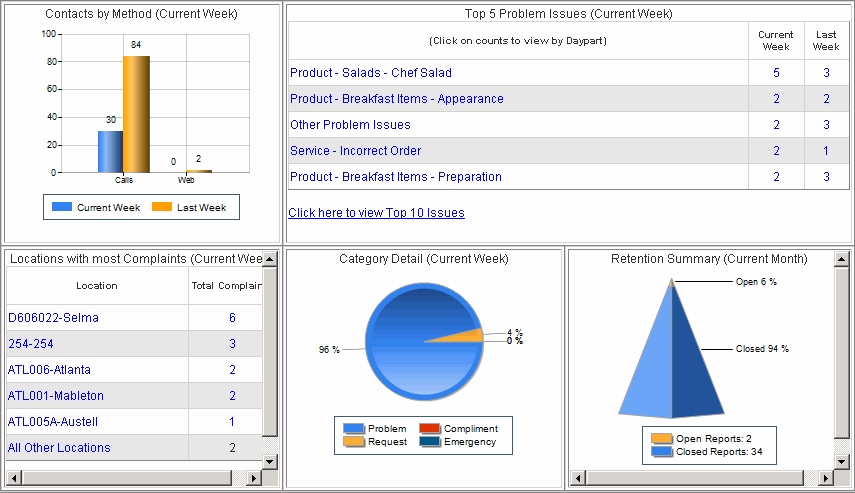
The new dashboard is designed to help you monitor what's going in your business at a glance.
The information displayed in the dashboard is a high-level summary to quickly show you what's happening in your business. This serves as a starting point for further investigation and details into why things are happening. The graphs and grids let you drill down to obtain further detail for analysis.
The reports in the dashboard are customizable for your needs. There are five frames available for you to display your reports. The reports may be displayed in a grid or graph format.
Contact your Account Manager to make the Dashboard available when you access www.servicecheck.net.
Dashboard Sample